- the indicator
- Posts
- Sell Signal
Hey everyone, welcome back to another issue of the indicator. This past week on the daily chart we saw sell signal’s on the NASDAQ, AAPL, & Crypto just to name a few. We have not seen a sell signal on Bitcoin as of yet. Will we? In this issue we’ll cover the trending markets & bonus sections. Let’s dive into the charts together!
Trending Markets:
Bitcoin
Crypto
Stocks
Bonus Sections:
Opportunity Alert
Trading/Investing Tips
A community of traders & investors on a mission to snipe the markets.
Bitcoin
Let’s start with the monthly chart to identify the overall trend. We had talked about “Buy The Right Dip” all of 2022. January 2023 was a higher probability reversal based on the weekly & daily chart. In hindsight, that buy at $16,800 was buying the right dip & has been buy the dip season since.
Buy Signal
Candle close above blue band
Trending dots are green & trending upwards
RSI Buy Signal


The weekly chart has been “overbought” since the middle of October & price just came up short from hitting longer-term target 4 by $3,000.

The daily chart has been consolidating sideways since December 5th. Also the charts are telling us of a possible retracement for the next possible buy the dip scenario. Two scenarios that we’ve been talking about since December 7th. As a reminder, below are the two scenarios & few things to point out.
Bearish divergence
Reversal candle
MACD bearish crossover
Still haven’t seen a sell signal and/or a confirmed lower high
Price would have one last push upwards to hit the 4th target out of 4 longer-term targets mapped out at the bottom of the bear market. Then have a bigger retracement prior to the halving that would present the next buy the dip scenario.
We see a sell signal & price puts in a lower high, retraces to lower targets prior to the halving event, & then another buy the dip scenario prior to the halving.

Recap: Monthly chart is still bullish, weekly chart is currently ultra bullish, & the daily chart is still bullish but is showing signs of a shorter-term retracement. Possible retracement targets could be:
Sub $38,000
Sub $35,000
and as low as $30,000
Obviously price could always go lower but then something would be off in my opinion and we’ll continue to take it level by level.
Crypto
Bitcoin does not have a sell signal as of yet but several big named crypto assets also have bearish divergence, reversal candles, MACD bearish crossover’s, and have had sell signals on the daily chart to start their corrections.

Eth 1 of 4 shorter-term targets have been hit so far

Dot has hit 2 of 4 targets so far

Near has hit 1 of 4 targets so far

Sol Sell Signal

Ada 1 of 4 targets so far
Stocks
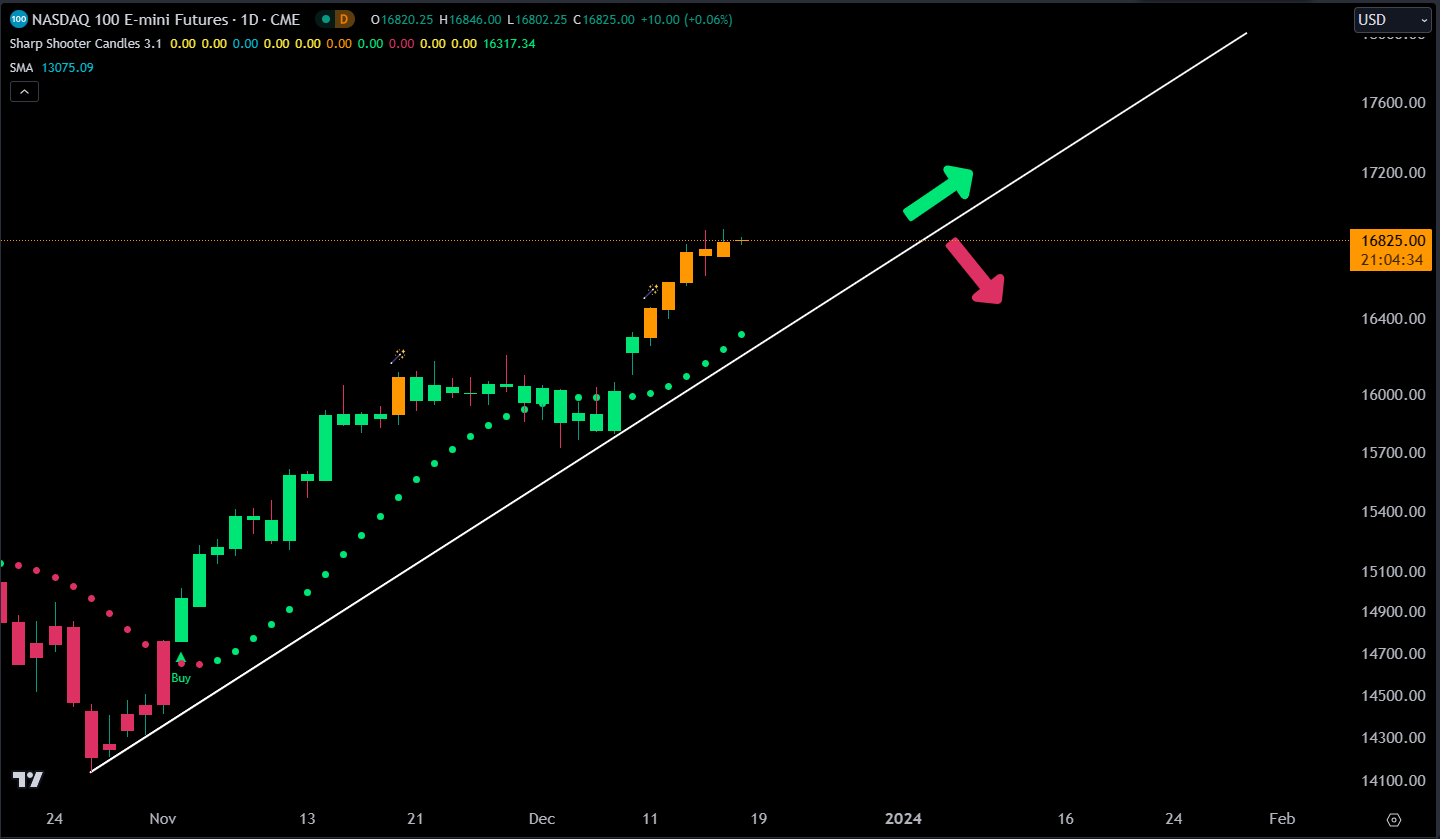
NASDAQ futures daily chart:
There was bearish divergence
Price closed below trending dots
Price closed below longer-term upward trend line
Sell signal
Target 1 of 4 has been hit so far


AAPL is currently and quietly down -10% since making another all-time high price.
Daily Chart:
Bearish divergence
Sell signal
3 of 4 targets have been hit so far
If price doesn’t find support at target 3 or 4 and starts to breakdown, then we could see some lower prices.

Weekly chart also has longer-term bearish divergence and had a sell signal last Friday as well. This isn’t a good sign for the bulls.

Opportunity Alert:
PTON weekly chart just had a buy signal after hitting a low of $4/share. Possible longer-term buy & hold.
Daily chart is bullish
Weekly chart is bullish
Long-term bullish divergence going back to January 2022
145 week bear market with a -97.5% correction during that time
Caution:
A more defined higher low on the weekly chart is a higher probability
There could be a pull back on lower time frames prior to price continuing higher
The potential longer-term targets:
Sniper Target Boxes
200-week moving average is currently at $49
Large 27% Gap at $85


If you love charts, then make sure to follow our posts, videos, & live streams here:
Jesse Olson Twitter (65,000+)
Jesse Olson Youtube (2,000+)
Market Sniper Twitter (7,000+)
Ready to block out the noise? Join us in the discord with either one of the subscriptions by signing up here: Market Sniper Website
Trading & Investing Tip:
Moving Average Convergence Divergence (MACD) is a trend-following momentum indicator that shows the relationship between two exponential moving averages of a security’s price.
Although the MACD isn’t apart of my personal trading strategy it is one of the most popular indicators for beginners & I still do like to look at it from time to time.
Many know the basics of the MACD of when the MACD crosses the signal line that there could be a trend change.
Many times the MACD will have a bearish or bullish crossover as shown in this Bitcoin daily chart below but price continues higher. (Divergence) In the chart below Bitcoin price has continued higher and/or has gone sideways for the past month while MACD has had 3 bearish crossover’s, continues downward, & the histogram has also been decreasing.
Price & the MACD have been diverged and eventually price will catch-up.
TIP: MACD above the zero line is considered bullish & below it is considered bearish, so when there is a bearish crossover but it’s considerably higher than the zero line, then price may not drop as far as say if there was a bearish crossover below the zero line.

Disclaimer
The contents of this newsletter are expressed in my opinion only, none of which is financial advice. Always do your own research as this information is intended for educational & entertainment purposes only.
Any suggestions, comments or questions, please feel free reply to this email.
Reply