- the indicator
- Posts
- Bearish Weekly Candle
Bearish Weekly Candle
Yesterday, the weekly candle close for Bitcoin was bearish.
Jesse Olson
January 15, 2024
In this issue we’ll cover Bitcoin, DOT, NASDAQ, & a longer-term opportunity alert.
Thank you for your continued support by sharing this newsletter!
A community of traders & investors on a mission to snipe the markets!
~ Market Snipers
Bitcoin
With all of the ETF news & social media coverage over the past few months. We mentioned it could be a sell the news type of event. We laid out two possible future buy the dip scenarios as written below. After price nailed longer-term target 4 of 4 and reached as high as $49,000. We quickly started to notice a reversal. It started with lower time frames and then moved onto higher time frames.
On the daily chart, MicroStrategy Inc had a very similar looking bearish daily candle close. (Leading indicator we kept asking)
On the daily chart, Bitcoin had a very similar looking bearish candle as BTC’s recent weekly candle. Then prices went lower.
On the weekly chart, Bitcoin had a bearish weekly candle close as you can see in chart 1 & even the indicator shown in chart 2 that it flipped from overbought orange candles to green candles
Five weeks ago we laid out two possible future buy the dip scenarios.
Price would have one last push upwards to hit the 4th target out of 4 longer-term targets mapped out at the bottom of the bear market. Then have a bigger retracement prior to the halving that would present the next buy the dip scenario.
We see a sell signal & price puts in a lower high, retraces to lower targets prior to the halving event, & then another buy the dip scenario prior to the halving.
Scenario 1 is currently playing out, doesn’t mean it’ll continue to play out but is as of writing this.


What now? Good question, my personal strategy (not financial advice) I’ll be waiting for the next “Buy The Right Dip”. If Bitcoin were to hit similar targets to the downside, then let’s take a look at MSTR. What if similar targets get hit as MSTR? As shown below, 3 of 4 shorter-term targets have been hit so far. If price does not find support at target 4 and bounce, then see red arrow. The 200-week moving average & the smaller gap are both below target 4 so it’s possible.

MSTR Daily Chart

Bitcoin Daily Chart & Next Buy The Dip Idea
Video update quickly covering everything in this newsletter about Bitcoin, Dot, Nasdaq, & UNG. 👇
Crypto
Unlike Bitcoin, many of the crypto assets had already started their 30%+ corrections. Not all of them are going to look similar but several of the charts are looking similar so I chose DOT as the example in this newsletter update. I may send out a crypto only newsletter later this week. Should I? If so, reply to this email and let me yes, no, & what crypto assets you would like me to cover.
Dot Recap:
Bearish divergence
Candles were orange aka overbought
Price started putting in a lower high signaling further downside
Sell signal
RSI sell signal
MACD bearish crossover
2 of 4 targets have been hit so far
Downward trend line drawn out for the next possible buy the dip scenario

Stocks
We’ve been covering the NASDAQ on the youtube daily live streams. If you haven’t watched them, then we definitely recommend joining us live and/or on the replay crew.
Quick recap of the live stream & charts below:
Bearish divergence on the daily chart
Price broke down & had a sell signal
Price was finding support after hitting target 1 of 4 to the downside
We mentioned that if price puts in a lower high, then it’s a higher probability of hitting lower targets
It’s currently too early to say but it’s starting to look like a lower high might be getting put in. In the discord I laid out my exact plan of shorting the NASDAQ with futures based on lower time frames. I mentioned I currently am not but I could be in the near future. Now my stop loss is set.

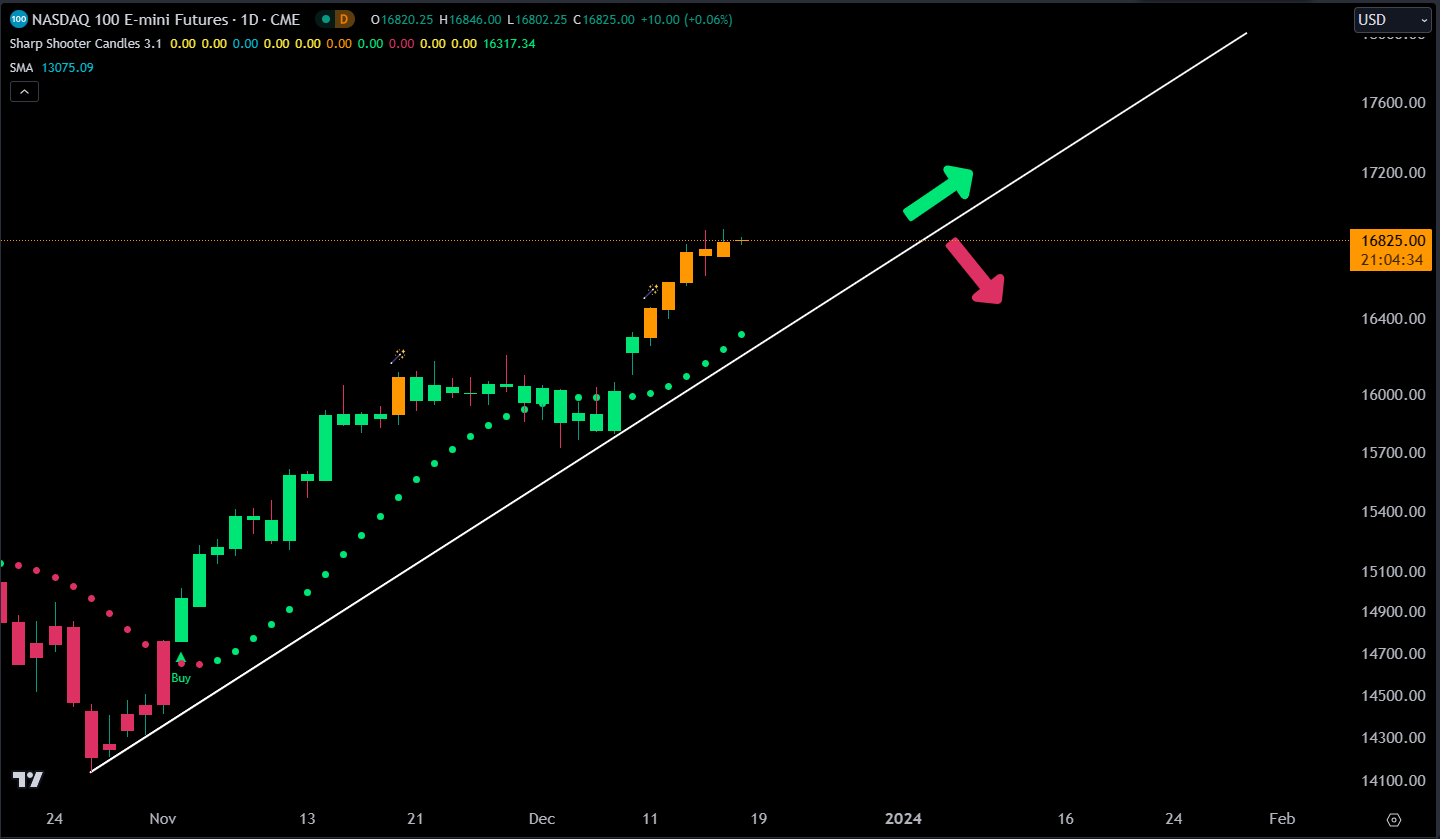
Daily Chart

Daily Chart Update

Daily Chart Update 2.0
Opportunity Alert:
United States Natural Gas Fund (UNG) weekly chart just had a buy signal after hitting a low of $4.50/share. Possible longer-term buy & hold. There are several similarities and patterns as Bitcoin believe it or not. 🙂
Daily chart is ULTRA bullish
Weekly chart is bullish & just had a buy signal
Long-term bullish divergence going back to January 2023
68 week bear market with a -87% correction during that time
Caution:
A more defined higher low on the weekly chart is a higher probability
There could be a pull back on lower time frames prior to price continuing higher due to the daily chart being ultra bullish
The potential longer-term targets:
What if price hit 4 of 4 longer-term targets similar to Bitcoin?
200-week moving average hasn’t been retested since December 2022 & is currently at $13.50.

UNG Weekly Chart
If you love charts, then make sure to follow our posts, videos, & live streams here:
Jesse Olson Twitter (65,000+)
Jesse Olson Youtube (2,000+)
Market Sniper Twitter (7,000+)
Ready to block out the noise & join us? Learn from & collaborate with like-minded people who are charting, investing, trading assets like bitcoin, crypto, stocks, futures, & commodities.
Here is what is included. 👇 Private Discord + Sharp Shooter Candles Indicator 3.1 Includes ($29):
• Community of Like-Minded People
• Ask Me Questions
• Receive Chart Updates
• Important Announcements
• Video Updates
• Sharp Shooter Candles 3.1 Indicator
• Crypto Volume Alerts
• Coin Listing Alerts
• Access to Beta Dashboard Test
• & More to Come!
Sharp Shooter Package - (Best Value $79) Includes: • Everything listed above 👆
• 60+ Hours of Recorded Coaching Sessions
• 2nd RSI Sharp Shooter Indicator to help detect divergences
• Private Discussion Group with Fellow Market Snipers
• 2.1 Crypto & Stock Screener Alerts of Potential Buy/Sell
• Access to Beta Dashboard Test
• & More to Come!
If so, become a member by clicking here: Website
Disclaimer
The contents of this newsletter are expressed in my opinion only, none of which is financial advice. Always do your own research as this information is intended for educational purposes only.
Any suggestions, comments or questions, please feel free to reply to this email.
Reply